Hey there, I’m Eeshan. I write about local AI, data science, and building real projects with agentic tools, with a bias towards human-centric approaches to working with new technologies.
You can also find my live projects at eeshans.com.
This article is another one in my local AI series, where I continue to test & evaluate fully local, private and offline AI models that can run on my laptop and don’t need any GPUs or data centers.
#1: It’s time for the regular person to start testing local AI models
#3: Testing local AI models by asking them to build Cherry Blossoms and Solar Systems
The last post was level 2 of evaluating local LLMs with some visual benchmarks. Tasking models to build out HTML animations like cherry blossoms, solar systems, sunsets etc. was a very subjective but fun way to quickly assess the “quality” of a model. Qwen 3.6 27B was awesome, but painfully slow, so my practical champion from the last test was Qwen 3.6 35B A3B.
Now I want to move this evaluation to level 3 - can I use a local AI model to do some data science tasks?
This is my daily job, and any real data scientist reading this would absolutely be correct to point out that I don’t really NEED an LLM to run an end-to-end A/B test analysis. This is why A/B testing platforms exist, and even without that it’s pretty easy to automate in a very deterministic and reliable way. So that’s why I’m calling it out right now. The real purpose of this test is to put these models through multiple different tasks, higher complexity agentic loops, and maintain a high level of accuracy while performing statistical analysis.
As I experiment further, I’ll move from stupid use cases (cherry blossoms) to unnecessary use cases (a/b test analysis) to reasonable use cases (use LLM where truly needed). For now, let’s see how this unnecessary but fairly interesting use case panned out with some local AI models that I can run completely on my laptop.
TL;DR
This new benchmark tests whether a local model can simulate a tiny amount of tasks as a data scientist: API calls, statistical correctness, visualizations, and product judgment.
The data is coming in from a live A/B test from my A/B Simulator memory game, which you can try as well.
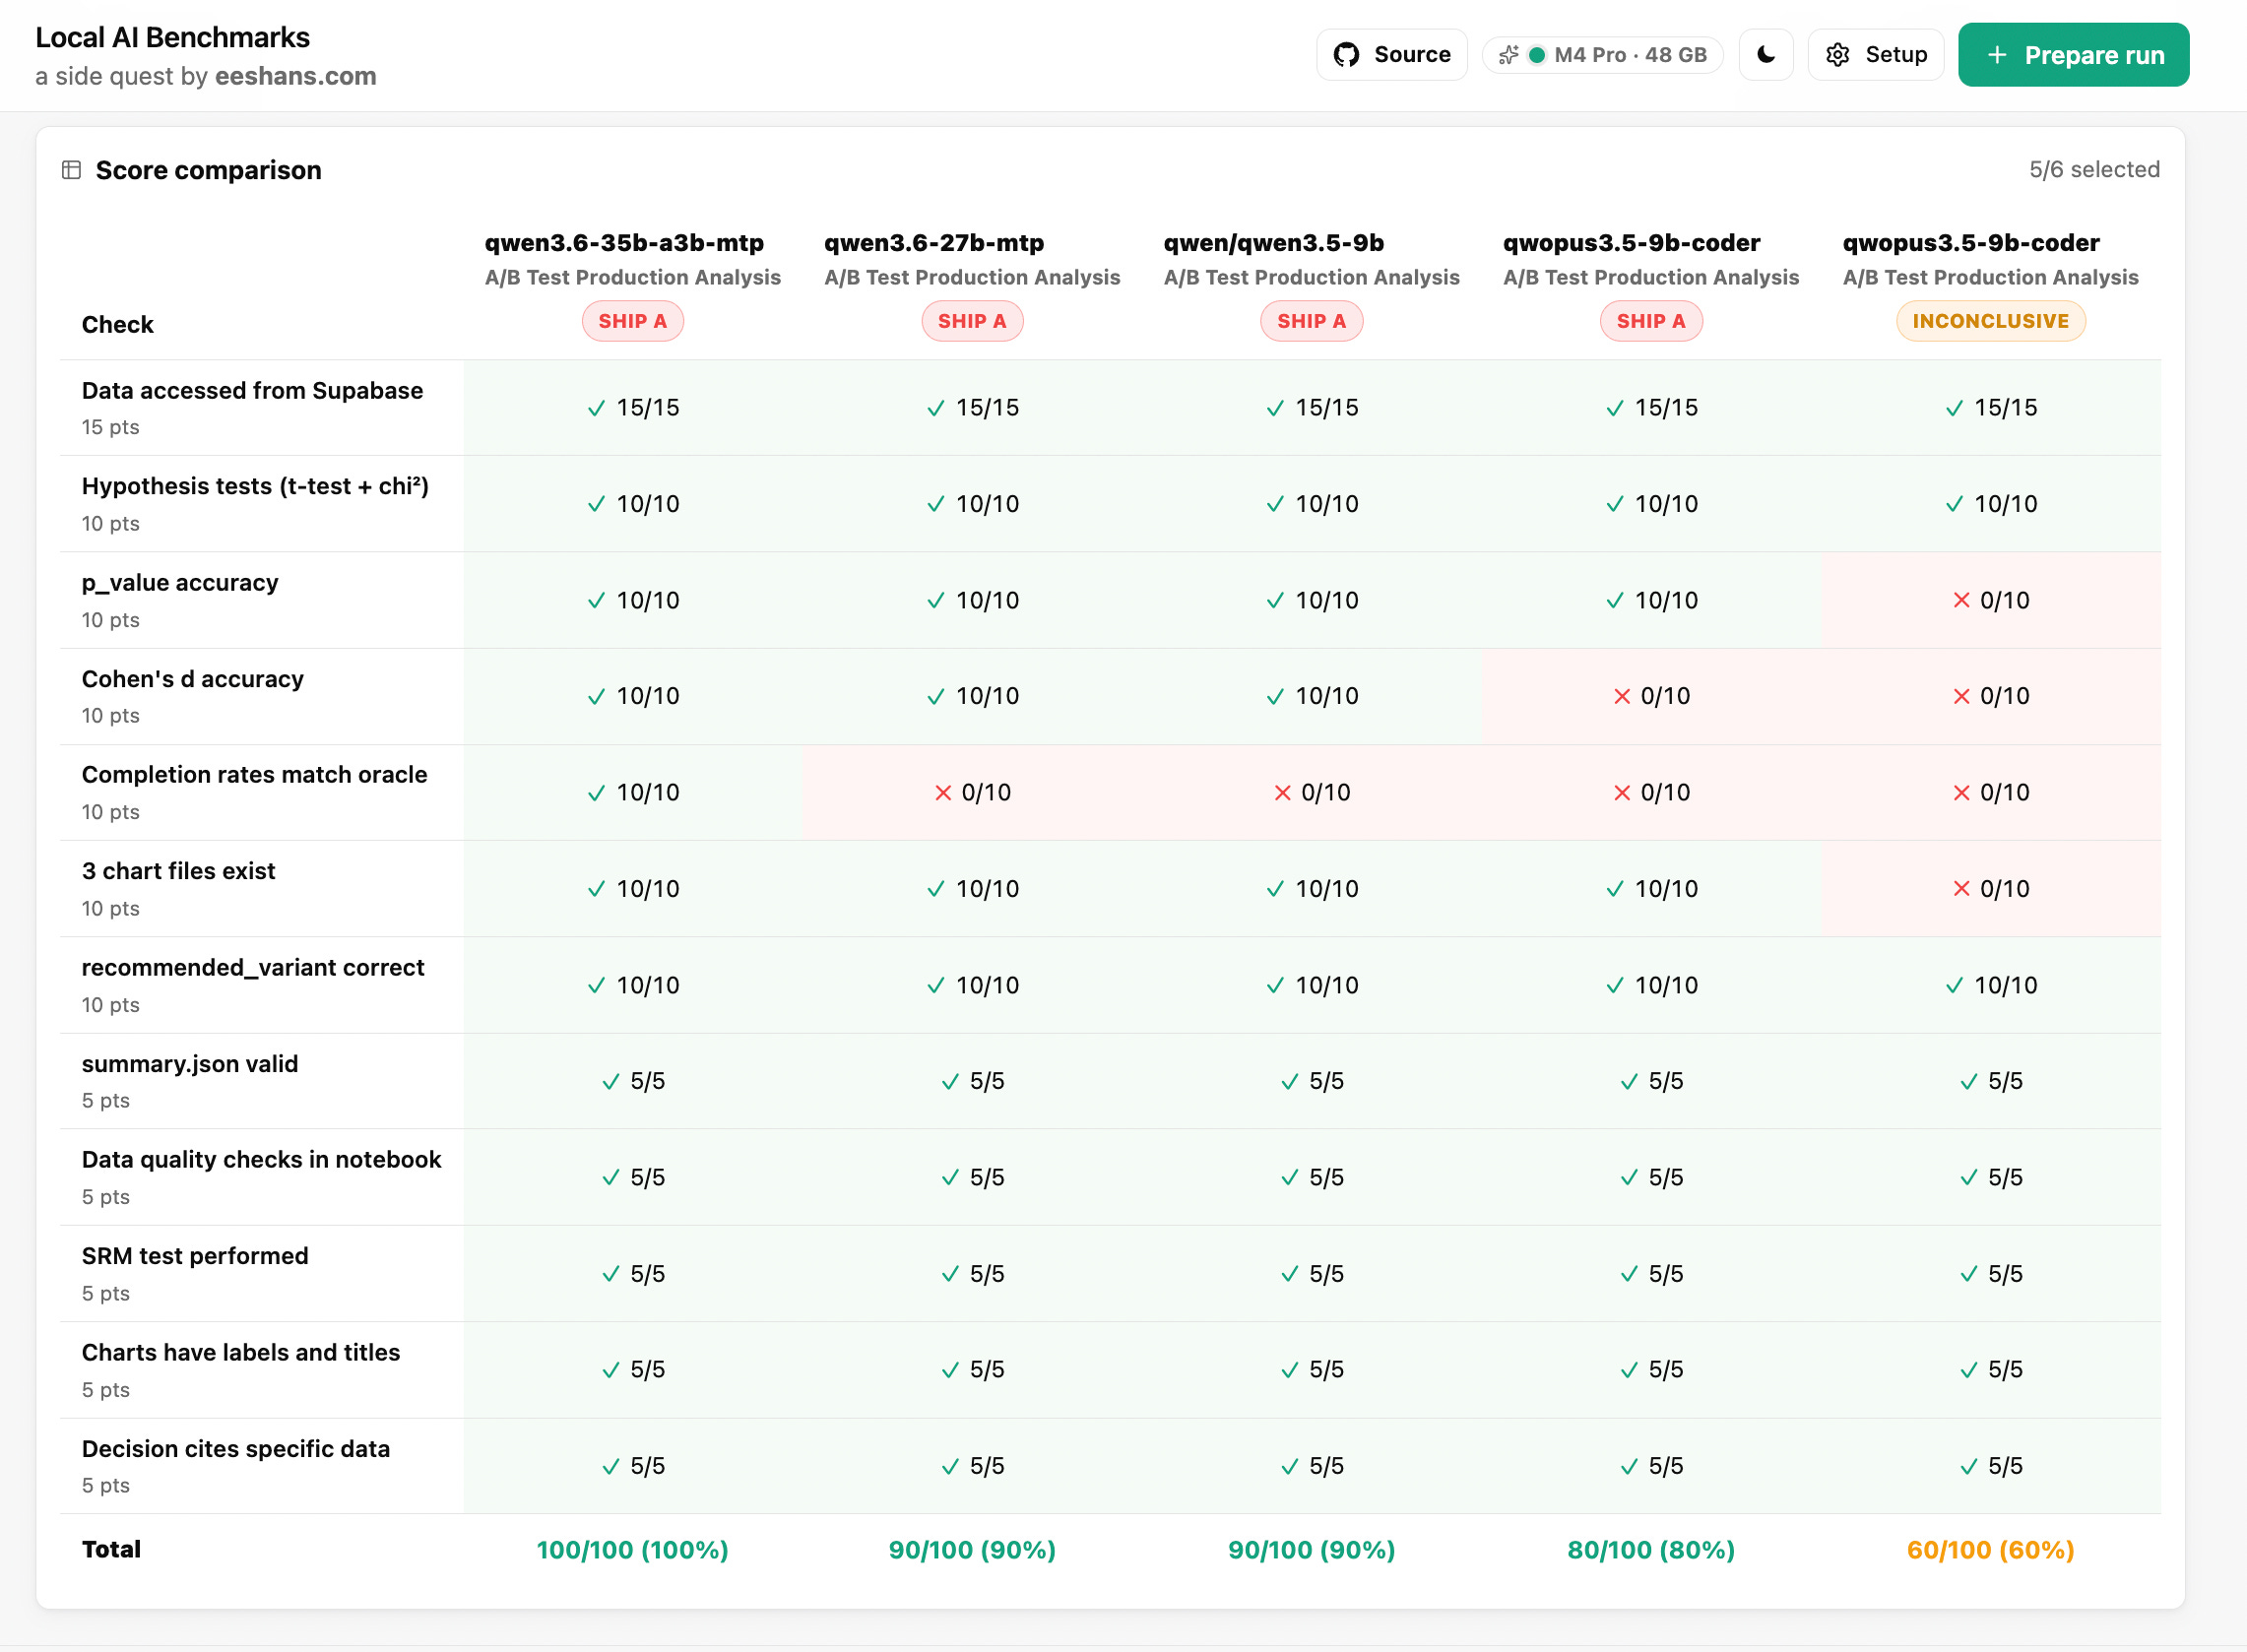
Tested four local models that work pretty well on my laptop. One got a perfect 100/100. Two got 90/100, but missed the same metric. One scored 60/100, accessed the data correctly, but mangled the processing very badly through excessive loops.
You can check the results at my workbench - localai.eeshans.com.
What we’re testing the models on
The visual benchmark from last time required the models to produce one HTML file, and tested complex reasoning, physics, graphics etc. This benchmark is technically more complex due to the addition of multiple steps that all need to be sequenced correctly:
Tool calling: Must make real HTTP requests to Supabase using provided credentials
API understanding: Must find the right table, use correct filters, select correct columns
Statistical procedure: Must check SRM before trusting results, use Welch’s t-test, compute effect size and CI
Multi-metric reasoning: Must check completion rate and repeat rate as guardrails, not just the primary metric
Product judgment: Must produce a grounded ship/don’t-ship recommendation
Hallucination resistance: All numbers must come from queried data, not invented
The model gets the Supabase URL, the API key, the table schema, and a prompt that describes the experiment. It has to write a Python notebook, produce three charts, and output a structured summary.json. Then an automated scorer (100 points, 12 checks) compares the output against a reference analysis I pre-computed from the same data.
If any of the numbers are wrong — wrong p-value, wrong completion rates, wrong recommendation — the score drops. This test is supposed to be far more deterministic, and pretty much how a real world data science job plays out. If we make a mistake, we are accountable for it.
A live A/B Test
The A/B Test here is a basic memory game. This was one of the first projects I made when I got into agentic coding using LLMs. Users are randomized in a 50/50 split as they land on the website, orchestrated through a Posthog feature flag. This is a good project to explore if you are new to A/B Testing and want to learn how to set one up end to end.
It’s a very simple setup. Variant A has 4 pineapples you need to memorize in 7 seconds and find in 60 seconds. Variant B has 5 pineapples to find.
Try it out here: absim.eeshans.com
Test Hypothesis: does adding an extra pineapple make the game harder?
Ground truth from the reference analysis:
Completion time: Variant A is faster / easier — 5.7s vs 8.9s (p = 0.0006, Cohen’s d = 0.40)
Completion rate: Variant A is much better — 88.9% vs 70.7%
Recommendation: This is subjective, but let’s say we stick with Variant A, because Variant B is worse on both the primary metric and guardrails.
The model’s job was to reach this conclusion from raw event data and a descriptive prompt. No other guides or reference notebooks were provided.
Results
Qwen 3.6 35B A3B (MTP) — 100/100 ✅
Perfect score. Every check passed: correct p-value, correct Cohen’s d, correct completion rates, correct recommendation, all three charts present and labeled.
This is the same MoE model I recommended in Series #3 as the best balance of speed and quality. It turns out that recommendation holds for data science too. It ran the full analysis — Supabase API call, SRM test, Welch’s t-test, chi-square for guardrails, three charts, a clear recommendation — and got everything right.
This model is just so smooth, and sometimes you won’t be able to tell if you’re running a cloud-based model or a local model watching it run. Just like all the other localmaxxing bros on X, I’m waiting for a Qwen 3.7 version of this model to see if it gets even better from here.
Qwen 3.6 27B (MTP) — 90/100 🟡
Almost perfect analysis but one mistake: completion rates were wrong. Also, this model was slow as hell to run on my laptop.
The model computed completion rates of 95.6% vs 96.5% and concluded there was no significant difference. The real rates are 88.9% vs 70.7%, which is a much bigger difference.
The 27B model likely computed completion rate at the session level (did this session ever complete a puzzle?) instead of the attempt level (did each puzzle attempt complete?). The prompt explicitly said to treat each puzzle_completed event as a separate observation, but the model still got the denominator wrong. This is a classic rookie mistake for anyone new to clickstream data.
Everything else — p-value, Cohen’s d, SRM test, charts, recommendation — was correct. But missing a guardrail that big in a real experiment could lead to a bad product decision. If this were a work scenario, someone would catch it in review.
Qwen 3.5 9B — 90/100 🟡
Same score as the 27B. Same mistake as well.
Computed completion rates at 95.7% vs 96.6% instead of the real 88.9% vs 70.7% — identical failure mode. But everything else was spot on: correct p-value (0.00056), correct Cohen’s d (0.40), SRM test present, all three charts done and labeled, correct recommendation for Variant A.
This is actually the surprise of the bunch. It’s a 9B model — less than a third the size of the 27B — and it ran the full pipeline: Supabase API, data quality checks, t-test, chi-square, charts. The only thing it got wrong was the metric definition, and it’s the same error the much larger model made. For a model this size, that’s pretty good. It means you don’t necessarily need the big guns for analysis tasks, as long as you’re willing to verify the output.
Qwopus 3.5 9B Coder — 60/100 🟠 -> 80/100 🟡
This one is the most interesting failure because it did try. It wrote 300+ lines of Python with proper imports, API access, t-tests, chi-square, charts etc. But it made wrong data processing decisions and continued to compound those errors.
First, it deduplicated the data incorrectly — drop_duplicates(subset=['user_id', 'session_id'], keep='last') — destroying most of the data before starting the analysis. Then it aggregated to user-level means instead of treating each puzzle attempt as an observation. This washed out the real difference between variants (8.4s vs 9.6s instead of the real 5.7s vs 8.9s). That’s why the p-value came out at 0.42.
Completion rates: 443.8% and 186%. This one was particularly dumb — I’m surprised it didn’t catch the error itself. The chi-square tests were run on single-variant contingency tables. It used outlier rate instead of repeat rate as a guardrail. And the final decision text was internally contradictory: it claimed B showed a “statistically significant improvement” with a p-value of 0.42, then recommended A anyway.
This wasn’t a hallucination problem though. The model pulled real data from Supabase and then mangled it through a chain of bad decisions. It’s like a junior data scientist who has the programming capability but doesn’t know how to structure the analysis. A human would eventually ask for help, but as you know, these models will confidently keep going.
Rerun update: I ran the same model again with the same prompt and it scored 80/100. The p-value was correct this time (0.00056), the means were right (5.7s vs 8.9s), and it even produced a proper notebook. But Cohen’s d came out at -3.49 instead of ~0.40, and completion rates were 100% for both variants.
This is the LLM experience if you don’t already know. You can give the same model the same task, and it will give you two completely different answers. Non-determinism is the inherent nature of LLMs and any serious implementations need to always take this into account.
Some interesting takeaways on metrics and models
So my evaluations have now moved from “the model can code” to “the model can do statistics correctly”. The Qwen 3.6 35B MoE model remains the practical champ for me. The 27B and Qwen 3.5 9B were great too, but both made the same metric definition error, a very “human” error in some ways. The Qwopus 9B coder was a bit weird. It had all the tool calling & coding capability, but seems to be lacking in statistical reasoning and putting everything together.
A few things stood out:
Metric definitions matter in clickstream data. Both the 27B and Qwen 3.5 9B computed the right p-value (0.00056 vs oracle 0.00063) but the wrong completion rates. Getting the math right on the wrong metric is still wrong. In a real experiment, this could change the decision.
LLM specializations have tradeoffs. Qwopus 3.5 9B Coder is actually a fine-tune of Qwen 3.5 9B, post-trained specifically for agentic coding and tool calling. The base Qwen scored 90. The coding-specialized version scored 60. Optimizing for code generation seems to have come at the expense of the statistical reasoning and data processing judgment that the general-purpose model retained.
MoE models are punching above their weight. The 35B A3B is a Mixture of Experts — only a fraction of its parameters are active at any time. Yet it scored a perfect 100 on a task that requires serial reasoning across API calls, data wrangling, statistics, and visualization.
Same model, same prompt, different result. The Qwopus coder scored 60 on the first run and 80 on the second. Different errors each time. Local models are non-deterministic — you can’t assume that getting the right answer once means it’ll get it again.
I’ll follow this up with more tests — Gemma 4 26B A4B is next on the list, and I expect similar quality from the MoE architecture.
Try it yourself
The benchmark is part of my local-llm-visual-benchmark workbench. If you want to replicate this:
Clone the repo and run
npm run devPrepare a run for the “A/B Test Production Analysis” benchmark
Pick your model, copy the prompt, and let it run. You can use my local-llm cli helper with llama.cpp config automation as well.
Score it with
python scripts/score-ds-run.py runs/ab-test-analysis/<model-slug>/<run-id>
The scoring is deterministic, so your results should be comparable to mine.
I’d be curious to see how other local models perform. If you run this on a model I haven’t tested, drop the results in the comments or tag me.
Appendix: The benchmark prompt
For anyone who wants the exact prompt I used. The model receives this, a supabase.json file with API credentials, and nothing else.
The A/B Simulator is a Pineapple Finder memory game. Variant A has 4 pineapples, Variant B has 5. Data lives in a Supabase
posthog_eventstable that records player interactions from live randomized traffic.Each row is one event. The important event types are
puzzle_startedandpuzzle_completed. Thevariantcolumn (A or B) is assigned per session. Thecompletion_time_secondscolumn is only populated onpuzzle_completedevents. A single session can have multiple puzzle completions — treat eachpuzzle_completedevent as a separate observation for the primary analysis, not one per session.Data Access: Supabase connection details are in
supabase.json. Read it and query the API.Required Outputs:
analysis.ipynb,summary.json,chart-distribution.png,chart-treatment-effect.png,chart-completion-rates.pngRequired Sections: Setup & data pull, metric definitions & sanity checks (SRM, data quality), primary analysis (Welch’s t-test, CI, Cohen’s d), guardrail analysis (completion rate χ², repeat rate z-test), visualizations, conclusion & recommendation.
Full prompt + schema in the benchmarks directory.